

- The global events industry is projected to reach US$2.5 trillion by 2035, highlighting strong long-term growth.
- Corporate events, conferences, and exhibitions continue to drive a significant share of industry revenue.
- Research from Grand View Research indicates that event management software is expected to grow rapidly as organizers invest in AI, registration, attendee engagement, and analytics.
- Europe remains the largest events market, while Asia-Pacific is expected to record the fastest growth.
- Digital event technology has become a core investment for organizers managing on-ground events of every size.
- The latest on-ground event statistics show strong market growth, rising investment in event technology, increasing AI adoption, and greater demand for efficient registration, check-in, and attendee management.
- This article compiles more than 37+ verified statistics from trusted industry reports to help event organizers make informed decisions.
Key Takeaways
- The global events industry continues to grow steadily.
- Technology spending is increasing across the event lifecycle.
- Corporate events remain the largest event segment.
- Event management software is experiencing double-digit growth.
- AI, automation, and analytics are reshaping event operations.
- Event organizers are prioritizing better attendee experiences.
- Data-backed planning helps improve operational efficiency and event ROI.
Introduction
On-ground events are becoming larger, more technology-driven, and more data-focused. Whether you’re organizing a conference, exhibition, trade show, corporate meeting, festival, or university event, understanding industry statistics helps you make better planning decisions.
The numbers also reveal how attendee expectations are changing. Faster registration, contactless check-in, AI-powered communication, digital badges, and real-time analytics are no longer optional for many professional events. They have become standard practices for improving attendee experiences and simplifying event operations.
This article brings together 37+ verified on-ground event statistics from respected market research firms, industry associations, and event reports. Each statistic is supported by a trusted source, giving you reliable insights.
Table of Contents
What Are the Most Important On-Ground Event Statistics Every Event Organizer Should Know in 2026?
The on-ground events industry continues to expand as organizations invest more in business events, exhibitions, live experiences, and event technology. The following statistics are grouped into key categories to help you quickly understand the latest industry trends.
What Do Market Growth Statistics Tell Us About On-Ground Events?
The on-ground events industry continues to grow as businesses increase investments in conferences, exhibitions, trade shows, corporate meetings, sports events, and festivals. At the same time, event technology spending is rising as organizers focus on improving attendee experiences and operational efficiency.
1. The global events industry is projected to reach US$2.52 trillion by 2035,growing at a CAGR of 6.8% from 2024 to 2035.
This growth is driven by increasing demand for corporate events, exhibitions, conferences, sports events, and live entertainment.
2. The global event management software market is expected to reach US$17.33 billion by 2030, growing at a CAGR of 13.2%.
Demand is increasing as organizers adopt AI, mobile event apps, online registration, and attendee analytics.
3. According to Allied Market Research, Corporate events and seminars are expected to remain the largest segment of the global events industry through 2035.
Organizations continue investing in conferences, product launches, leadership meetings, and professional training events.
4. Sponsorship is the largest revenue source in the global events industry.
Brands continue increasing sponsorship budgets to improve visibility, customer engagement, and event marketing performance.
5. Europe currently leads the global events industry, while Asia-Pacific is projected to be the fastest-growing regional market.
Business travel, digital adoption, and expanding economies continue to support regional growth.
6. The Events Industry Market Reportshows that Adults aged 21–40 account for the largest attendee segment in the global events industry.
This age group continues to drive attendance at conferences, exhibitions, festivals, and corporate events worldwide.
7. Cloud-based event management software continues to hold the largest share of the market.
Cloud platforms simplify registration, attendee management, reporting, and event operations for organizers of all sizes.
8. Event software providers are increasingly integrating AI, VR, AR, IoT, and wearable technologies into their platforms.
These technologies are helping organizers deliver more personalized attendee experiences and improve event management.
What Do Event Volume Statistics Reveal About the Events Industry?
Organizations across industries continue to invest in conferences, exhibitions, trade shows, and business meetings because face-to-face interactions remain valuable for networking, education, and business growth. These statistics highlight the scale and continued recovery of the global on-ground events industry.
9. According to the IAEE 2026 CEIR Index Report, 2026, the U.S. B2B exhibition industry is forecast to grow by 2.1% in 2026.
The industry continues to recover with steady gains in attendance, exhibitor participation, and exhibition space.
10. The CEIR Index measures exhibition performance across 14 major industry sectors.
It tracks four key metrics: net square feet sold, professional attendance, exhibiting companies, and gross revenue.
11. Investment in corporate events is on the rise. Since 2019, 69% of high-performing companies have increased their spending on corporate offsites and events, reflecting a growing commitment to employee engagement and team connection (Emburse: The State of Corporate Offsites, 2025).
Higher event budgets indicate that businesses view in-person experiences as a strategic investment that supports talent retention, productivity, and long-term organizational performance.
12. Confidence in event attendance remains strong, with 77% of event professionals expecting attendance to meet or exceed pre-pandemic levels, according to the American Express Global Meetings and Events Forecast 2026.
This reflects continued optimism in the events industry, driven by sustained demand for face-to-face networking, collaboration, and business engagement.
13. Live events continue to have a stronger impact on brand trust than many other marketing channels.
Freeman’s latest research shows that in-person experiences are becoming even more influential in shaping audience perceptions.
14. Corporate offsites have become a regular part of business strategy, with companies hosting an average of 2.6 offsite events per year, highlighting the continued emphasis on in-person collaboration and relationship building (Emburse: The State of Corporate Offsites, 2025).
Organizations are increasingly using offsites to strengthen team culture, improve cross-functional collaboration, and boost employee engagement.
15. Millennials and Gen Z are expected to make up 75% of the global workforce by 2030.
This demographic shift is influencing how organizers design conferences, networking opportunities, and attendee experiences.
What Do On-Ground Event Registration Statistics Show?
Registration is the first touchpoint of the attendee experience. A fast, simple, and digital registration process reduces manual work, improves data accuracy, and helps organizers manage attendance more efficiently.
16. On average, 62% of attendees register within eight weeks of an event.
Late registrations continue to challenge organizers, making real-time registration tracking and automated communication increasingly important.
17. Around 21% of attendees register less than two weeks before an event.
A significant share of registrations happens close to the event date, increasing pressure on event operations and attendee management.
18. Maritz found that 43% of conference attendees register within four weeks of an event.
This trend highlights why automated registration workflows and attendee communication are becoming essential.
19. Email remains one of the most effective event marketing channels, with 51% of attendees deciding to register for an event after receiving an engaging email.
Well-crafted email campaigns play a crucial role in driving registrations by delivering timely, personalized, and relevant event information.
20. Event technology has become a core part of event planning, with more than 85% of event planners using event management software to streamline their operations.
From registration and attendee management to analytics and communication, event management platforms help planners improve efficiency and deliver better event experiences.
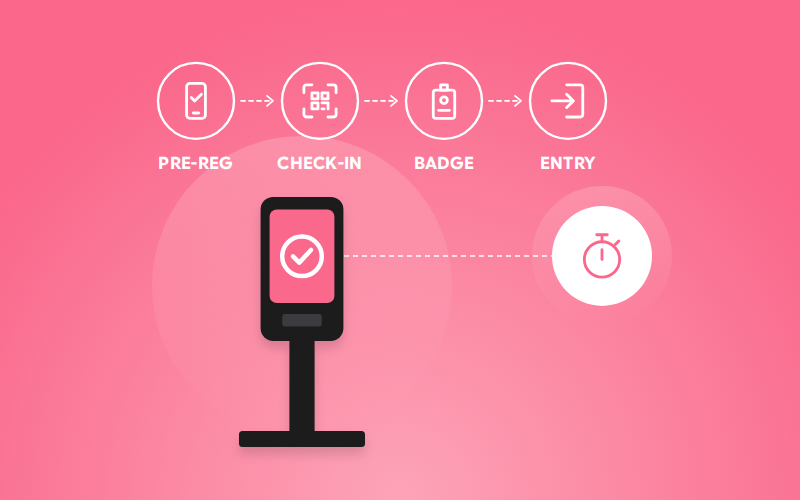
21. Modern event check-in systems should complete attendee check-in in less than 30 seconds.
Fast check-in reduces queues and creates a smoother first impression for attendees.
22. A single self-service kiosk can process approximately 80 attendees per hour.
Self-service check-in kiosks help reduce waiting times and improve attendee flow during peak arrival periods.
How Is AI Changing On-Ground Events?
Artificial intelligence is becoming a practical tool for event organizers rather than a future concept. From content creation and attendee engagement to data analysis and personalized experiences, AI is helping teams save time, make better decisions, and improve the overall event experience
23. 91% of meeting professionals say they already use AI while planning events.
Most organizations are now using AI for at least one stage of event planning, from content creation to attendee communication.
24. 50% of meeting planners identify AI as their top technology priority for 2025-26.
AI is being adopted to improve attendee experiences, automate workflows, and support event personalization.
25. AI-powered personalization is driving stronger business outcomes, with conversion rates increasing by 15–20% through personalized customer experiences.
By delivering tailored product recommendations, customized messaging, and relevant offers, AI helps businesses boost engagement and improve conversion performance.
26. 63% of associations and not-for-profits are already using AI to organize events.
Most organizations adopted AI despite having little or no dedicated budget for AI training.
27. AI is transforming customer support efficiency, with response times reduced by up to 90% through AI-powered automation.
Instant responses and automated assistance enable faster issue resolution, improve service efficiency, and enhance overall customer satisfaction.
28. AI-powered personalization is one of the defining event technology trends shaping meetings and conferences.
Organizers are increasingly using AI for agenda recommendations, networking, and attendee engagement.
29. AI is increasingly being used to improve networking and sponsor-attendee matching at live events.
Industry research points to AI-assisted matchmaking as one of the most promising applications for business events.
What Do On-Ground Event Check-In Statistics Tell Us?
A fast and efficient check-in process sets the tone for the entire event. Event organizers are increasingly adopting QR codes, self-service kiosks, mobile check-in, and real-time attendance tracking to reduce queues and improve operational efficiency.
30. Digital check-in solutions significantly improve attendee flow, reducing average wait times by 75% compared to traditional paper-based systems. (Dreamcast internal benchmark data, 2025-2026)
Faster check-in processes create smoother arrival experiences, reduce queues, and improve overall event efficiency.
31. Attendee check-in remains a major operational priority, with 89% of event planners identifying it as their top day-of-event concern. (Dreamcast, 2026)
Common challenges include registration bottlenecks, managing no-shows, correcting attendee details, and resolving technology-related issues during events.
32. Self-service check-in delivers higher processing efficiency, with kiosks handling approximately 180-200 attendees per hour per station, compared to 60–80 attendees per hour through staffed check-in desks. (Dreamcast operational benchmarks, 2026)
Automated check-in options help reduce workload on event staff while enabling faster attendee movement and shorter queues.
33. Walk-in attendees represent a significant portion of event traffic, accounting for 5–15% of total attendees across various event types and regions. (Industry survey, 2025)
Flexible walk-in management capabilities are essential for accommodating last-minute registrations and ensuring accurate attendance tracking.
34. Digital walk-in workflows accelerate on-site registration, with on-demand badge printing completing attendee processing in around 20 seconds, compared to 2-3 minutes with manual paper-based processes. (Dreamcast internal benchmark data, 2025-2026)
Automated registration, badge generation, and attendance capture help reduce delays and deliver a seamless check-in experience.
35. Large events can save 1–2 hours of setup time and reduce staffing needs by 2–4 people by replacing pre-sorted badge tables with on-demand badge printing.
Real-time badge printing streamlines logistics while making it easier to accommodate last-minute attendee changes.
What Do On-Ground Attendee Access Management Statistics Reveal?
Access management is no longer limited to checking badges at the entrance. Modern events use QR codes, RFID, NFC, mobile credentials, facial recognition, and real-time monitoring to improve security, control crowd movement, and give attendees access only to authorized areas.
36. The Event Access Management and Accreditation Platforms market is projected to grow at a CAGR of 8.6% between 2026 and 2033, reflecting increasing demand for digital credentialing and secure access management.
Organizations are investing in cloud-based accreditation, digital badges, and automated access control to enhance security and streamline event operations.
37. Integrated access management platforms provide end-to-end event control, combining registration, credential issuance, badge printing, check-in, and access permissions within a single system.
This reduces operational complexity while improving security, reporting, and event-day efficiency
38. Role-based access control improves event security and operations, enabling organizers to assign different access permissions for attendees, speakers, exhibitors, media, sponsors, and staff.
Granular access permissions reduce congestion, improve crowd management, and enhance the attendee experience.
Conclusion:
On-ground events continue to grow, and so does the need for smarter event planning. The statistics in this article highlight how organizers are investing in AI, digital registration, faster check-in, secure access management, and data-driven decision-making to improve event outcomes. Whether you are planning a conference, exhibition, corporate meeting, festival, or large-scale summit, these insights can help you benchmark your strategy, identify new opportunities, and make informed technology investments. As attendee expectations continue to rise, using reliable industry data will be key to delivering seamless event experiences and long-term success.
FAQs
On-ground event statistics help organizers understand industry trends, compare their event performance with market benchmarks, and make informed decisions about registration, attendee engagement, budgeting, event technology, and operational planning.
The most widely adopted technologies include online event registration platforms, QR code check-in, RFID and NFC access control, AI-powered event management tools, mobile event apps, badge printing solutions, attendee analytics, and event automation platforms.
Event organizers are using AI to create event content, automate attendee communication, personalize event experiences, analyze attendee data, recommend networking opportunities, and generate post-event insights that support future planning.
Some of the biggest trends include increased investment in event technology, AI-powered event management, contactless registration and check-in, real-time attendee analytics, digital badges, stronger event security, and more personalized attendee experiences.
The statistics are compiled from trusted industry reports and research published by organizations such as Allied Market Research, Grand View Research, UFI, CEIR, PCMA, Freeman, American Express GBT Meetings & Events, Statista, Events Industry Council, Skift Meetings, and other reputable research firms and industry associations.